System Monitor: 7 Powerful Tools to Boost Performance
Ever wondered why your computer slows down out of nowhere? A solid system monitor can be the game-changer you need to catch issues before they crash your workflow.
What Is a System Monitor and Why It Matters

A system monitor is a software tool designed to track, analyze, and report the performance and health of computer systems, servers, networks, and applications. Whether you’re managing a single workstation or an entire data center, real-time visibility into system behavior is crucial for maintaining stability, security, and efficiency.
Core Functions of a System Monitor
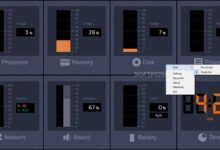
At its heart, a system monitor performs continuous observation of key metrics. These include CPU usage, memory consumption, disk I/O, network bandwidth, and process activity. By collecting this data, it helps administrators detect anomalies, prevent outages, and optimize resource allocation.
- Real-time tracking of hardware and software performance
- Alerting mechanisms for threshold breaches (e.g., 90% CPU usage)
- Historical data logging for trend analysis and capacity planning
“Monitoring is not about reacting to problems—it’s about preventing them.” — DevOps Best Practices Guide
Types of System Monitoring
System monitoring isn’t one-size-fits-all. Different environments require different approaches. The main types include:
- Hardware Monitoring: Tracks physical components like temperature, fan speed, and power supply status.
- Software Monitoring: Observes application performance, service uptime, and process health.
- Network Monitoring: Analyzes traffic flow, latency, and packet loss across connected devices.
- Cloud Monitoring: Focuses on virtualized resources in platforms like AWS, Azure, or Google Cloud.
Each type plays a role in building a comprehensive system monitor strategy that ensures end-to-end visibility.
Top 7 System Monitor Tools in 2024
Choosing the right system monitor tool can make or break your IT operations. Here’s a curated list of the most powerful and widely used tools available today, each offering unique features tailored to different needs.
1. Nagios XI
Nagios XI stands as one of the most trusted names in system monitoring. Known for its robustness and flexibility, it provides deep insights into infrastructure performance through customizable dashboards and advanced alerting.
- Supports monitoring of servers, applications, services, and network protocols
- Extensive plugin ecosystem for integration with third-party tools
- Offers both on-premise and cloud deployment options
With a strong community and enterprise support, Nagios is ideal for organizations needing granular control. Learn more at Nagios Official Site.
2. Zabbix
Zabbix is an open-source system monitor platform that excels in scalability and real-time monitoring. It’s particularly popular among mid-to-large enterprises due to its ability to handle thousands of devices simultaneously.
- Auto-discovery of network devices and services
- Built-in visualization tools like graphs and maps
- Supports SNMP, IPMI, JMX, and custom scripts
Zabbix also offers predictive capabilities using machine learning models to forecast potential failures. Explore its features at Zabbix.com.
3. Datadog
Datadog is a cloud-based system monitor solution built for modern DevOps teams. It integrates seamlessly with cloud platforms, containerized environments (like Docker and Kubernetes), and CI/CD pipelines.
- Real-time log management and correlation
- AIOps-powered anomaly detection
- Collaboration features like shared dashboards and incident tracking
Datadog’s strength lies in its unified observability approach—combining metrics, traces, and logs in one interface. Visit Datadog HQ for a free trial.
How a System Monitor Enhances Security
While performance optimization is a primary goal, a system monitor also plays a critical role in cybersecurity. Unusual system behavior often signals malicious activity, such as malware infections, unauthorized access, or data exfiltration.
Detecting Anomalies in Real Time
By establishing baselines for normal system behavior, a system monitor can flag deviations instantly. For example, a sudden spike in outbound network traffic might indicate a botnet infection, while unexpected process launches could point to privilege escalation attacks.
- Monitors login attempts and failed authentications
- Tracks file integrity changes in critical system directories
- Logs unusual cron job executions or script runs
“Over 60% of breaches go undetected for months. Continuous monitoring cuts that timeline dramatically.” — IBM Security Report
Integration with SIEM Systems
Many system monitor tools integrate with Security Information and Event Management (SIEM) platforms like Splunk or Microsoft Sentinel. This allows security teams to correlate system-level events with broader threat intelligence feeds.
- Forward system logs to centralized SIEM for analysis
- Trigger automated responses based on severity levels
- Generate compliance reports for standards like ISO 27001 or HIPAA
This synergy enhances threat detection and accelerates incident response times.
System Monitor for DevOps and CI/CD Pipelines
In agile development environments, a system monitor isn’t just for IT ops—it’s a vital component of the DevOps lifecycle. It ensures that code deployments don’t degrade system performance or introduce instability.
Monitoring Application Performance Post-Deployment
After a new version of an application is deployed, a system monitor tracks key performance indicators (KPIs) such as response time, error rates, and throughput. If metrics fall outside acceptable ranges, alerts can trigger rollbacks or notify developers immediately.
- Integrates with Jenkins, GitLab CI, and GitHub Actions
- Provides real-time feedback during canary or blue-green deployments
- Supports synthetic monitoring to simulate user interactions
This proactive approach minimizes downtime and improves user experience.
Enabling Infrastructure as Code (IaC) Observability
With the rise of IaC tools like Terraform and Ansible, system monitor solutions now track configuration drift—the difference between intended and actual infrastructure states.
- Detects unauthorized changes to server configurations
- Validates compliance with security policies
- Logs all configuration changes for audit trails
This level of observability ensures consistency across environments and reduces the risk of human error.
Key Metrics Every System Monitor Should Track
To be effective, a system monitor must focus on the right set of metrics. While the exact list may vary by environment, certain core indicators are universally important.
CPU Usage and Load Average
CPU utilization shows how much processing power is being consumed. Consistently high usage (above 80%) can lead to slowdowns and service degradation. The load average, especially on Unix-like systems, indicates the number of processes waiting for CPU time over 1, 5, and 15-minute intervals.
- Monitor per-core and total CPU usage
- Set alerts for sustained high load (e.g., load average > number of CPU cores)
- Correlate with application performance data
A sudden spike in CPU usage without a clear cause may indicate a runaway process or a denial-of-service attack.
Memory and Swap Utilization
Memory (RAM) monitoring helps prevent out-of-memory (OOM) errors that can crash applications. A system monitor should track both used and available memory, as well as swap space usage.
- Watch for memory leaks in long-running applications
- Alert when swap usage exceeds 20% (indicating memory pressure)
- Track memory consumption by individual processes
Modern tools like Prometheus and Grafana offer detailed memory profiling down to the process level.
Disk I/O and Space Availability
Disk performance is often a bottleneck in system performance. A system monitor should track read/write speeds, latency, and queue lengths. Additionally, disk space monitoring prevents outages caused by full drives.
- Set thresholds for disk usage (e.g., alert at 85%, critical at 95%)
- Monitor IOPS (Input/Output Operations Per Second) for database servers
- Detect slow disk responses that impact application latency
Tools like IOSTAT and SMART can be integrated into a system monitor for deeper hardware-level insights.
Best Practices for Implementing a System Monitor
Deploying a system monitor is just the beginning. To get the most value, organizations must follow proven best practices that ensure reliability, scalability, and usability.
Define Clear Monitoring Objectives
Before installing any tool, define what you want to achieve. Are you focused on uptime, performance tuning, security, or compliance? Your goals will shape which metrics to prioritize and how to configure alerts.
- Identify critical systems and applications
- Establish SLAs (Service Level Agreements) for response times
- Determine acceptable downtime windows
Without clear objectives, monitoring efforts can become unfocused and generate noise rather than insight.
Avoid Alert Fatigue with Smart Thresholds
One of the biggest pitfalls in system monitoring is alert fatigue—receiving so many notifications that important ones get ignored. To prevent this, use intelligent thresholding and alert deduplication.
- Use dynamic thresholds based on historical trends (e.g., higher CPU allowed during business hours)
- Implement alert grouping (e.g., all disk warnings from one server)
- Leverage AI-driven anomaly detection to reduce false positives
“The best alert is the one that leads to action—not panic.” — SRE Handbook, Google
Ensure High Availability of the Monitor Itself
It might sound ironic, but the system monitor itself must be monitored. If your monitoring tool goes down, you lose visibility precisely when you need it most.
- Deploy redundant monitoring servers in different locations
- Use heartbeat checks to verify monitor health
- Store logs and metrics in durable, offsite storage
Consider using a hybrid model: on-premise for internal systems and cloud-based for external services.
Future Trends in System Monitoring
The landscape of system monitoring is evolving rapidly, driven by advancements in AI, cloud computing, and edge technologies. Staying ahead of these trends ensures your monitoring strategy remains effective and future-proof.
Rise of AIOps and Predictive Analytics
Artificial Intelligence for IT Operations (AIOps) is transforming how system monitors work. Instead of just reporting what happened, modern tools use machine learning to predict issues before they occur.
- Analyze historical data to forecast resource exhaustion
- Automatically classify and prioritize incidents
- Recommend remediation steps based on past resolutions
Companies like Moogsoft and BigPanda are leading this shift, integrating AI into core monitoring workflows.
Edge Computing and IoT Monitoring
As more devices move to the network edge—smart sensors, industrial machines, remote gateways—the need for decentralized monitoring grows. Traditional centralized tools struggle with latency and bandwidth constraints in these environments.
- Deploy lightweight agents on edge devices
- Use fog computing to preprocess data locally
- Sync only critical alerts and summaries to central systems
This approach reduces overhead and enables real-time decision-making at the source.
Observability Beyond Monitoring
While monitoring answers “Is the system working?”, observability asks “Why is it working (or not)?”. This paradigm shift emphasizes deep introspection through logs, metrics, and traces (the “three pillars”).
- Adopt distributed tracing for microservices architectures
- Use structured logging (e.g., JSON format) for easier parsing
- Correlate events across services to identify root causes
Tools like OpenTelemetry are emerging as open standards to unify observability across platforms.
What is a system monitor used for?
A system monitor is used to track the performance, availability, and health of computer systems and networks. It helps detect issues like high CPU usage, memory leaks, disk failures, and security breaches, enabling proactive maintenance and minimizing downtime.
Can I use a system monitor for free?
Yes, several powerful system monitor tools offer free versions or are entirely open-source. Examples include Zabbix, Nagios Core, and Prometheus. These are suitable for small to medium environments, though enterprise features may require paid licenses.
How does a system monitor improve security?
A system monitor improves security by detecting unusual behavior—such as unexpected process launches or abnormal network traffic—that may indicate cyberattacks. It also integrates with SIEM systems to provide real-time threat intelligence and compliance reporting.
What are the best metrics to monitor?
The best metrics include CPU usage, memory utilization, disk space and I/O, network bandwidth, and application response times. For modern environments, also monitor container health, API error rates, and user session durations.
Is cloud-based system monitoring secure?
Yes, reputable cloud-based system monitor services use encryption, role-based access control, and compliance certifications (like SOC 2 or GDPR) to protect data. However, organizations should review data residency policies and configure access controls carefully.
In today’s complex IT ecosystems, a reliable system monitor is no longer optional—it’s essential. From preventing costly outages to enhancing security and supporting DevOps practices, the right monitoring strategy empowers organizations to operate with confidence. As technology evolves, embracing trends like AIOps, edge monitoring, and observability will ensure your systems remain resilient, efficient, and future-ready.
Further Reading:
